

Step-by-Step Guide to Data Modeling
The following is a step-by-step guide to data modeling in BI Office as described in the overview.
The wizard displays a series of panels to guide you through the process of importing and processing data into an analytic data model that can be analyzed in Data Discovery and then presented as a Story Board or Publication.
To begin, go to the Start page, click the yellow "New Data Modeling" button to launch the Data Modeling wizard (described here).
Step 1: Choose a Data Source
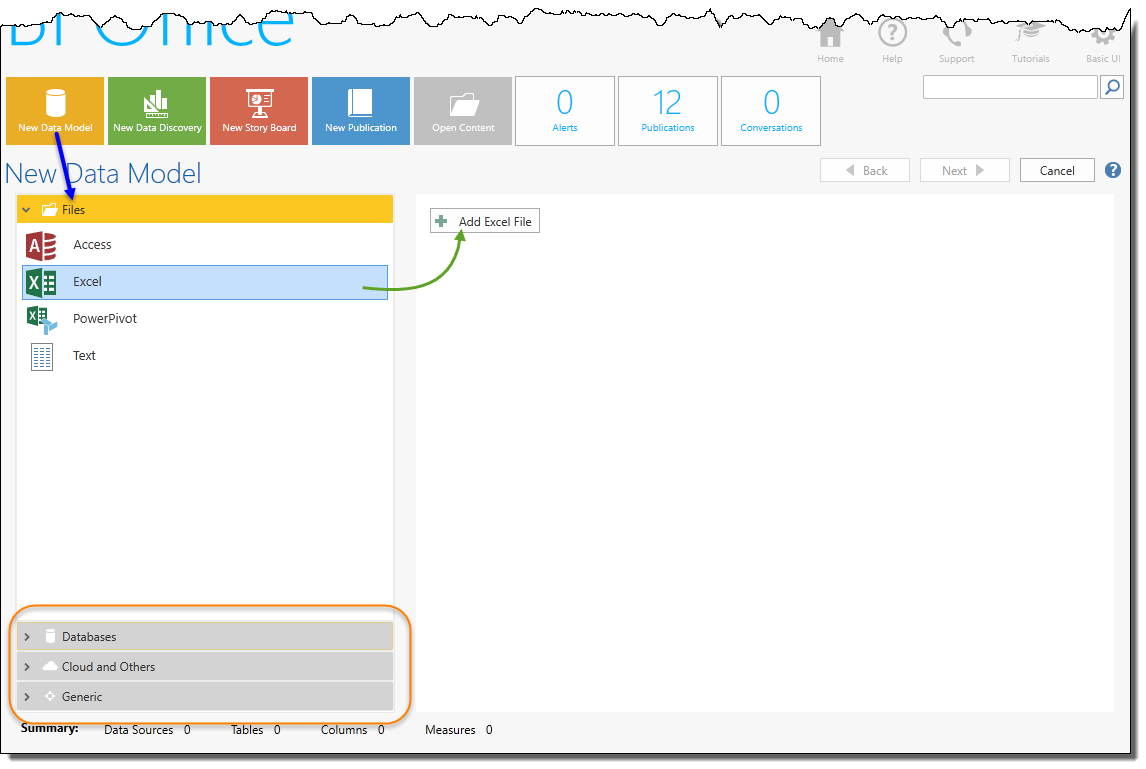
The data source options are displayed in the left-hand panel (blue arrow).
For each data source, the available options are shown on the right hand side. For example, the ability to upload an excel file is provided (green arrow). You can add multiple items from multiple data sources per model.
The data source options include file-based or local sources, configured sources (ie server databases and cloud sources), BI Office content and packaged sources.
Step 2: Selection of Data Sets
After selecting data sources, you are presented with a selection of potential data sets (tables) for each data source.
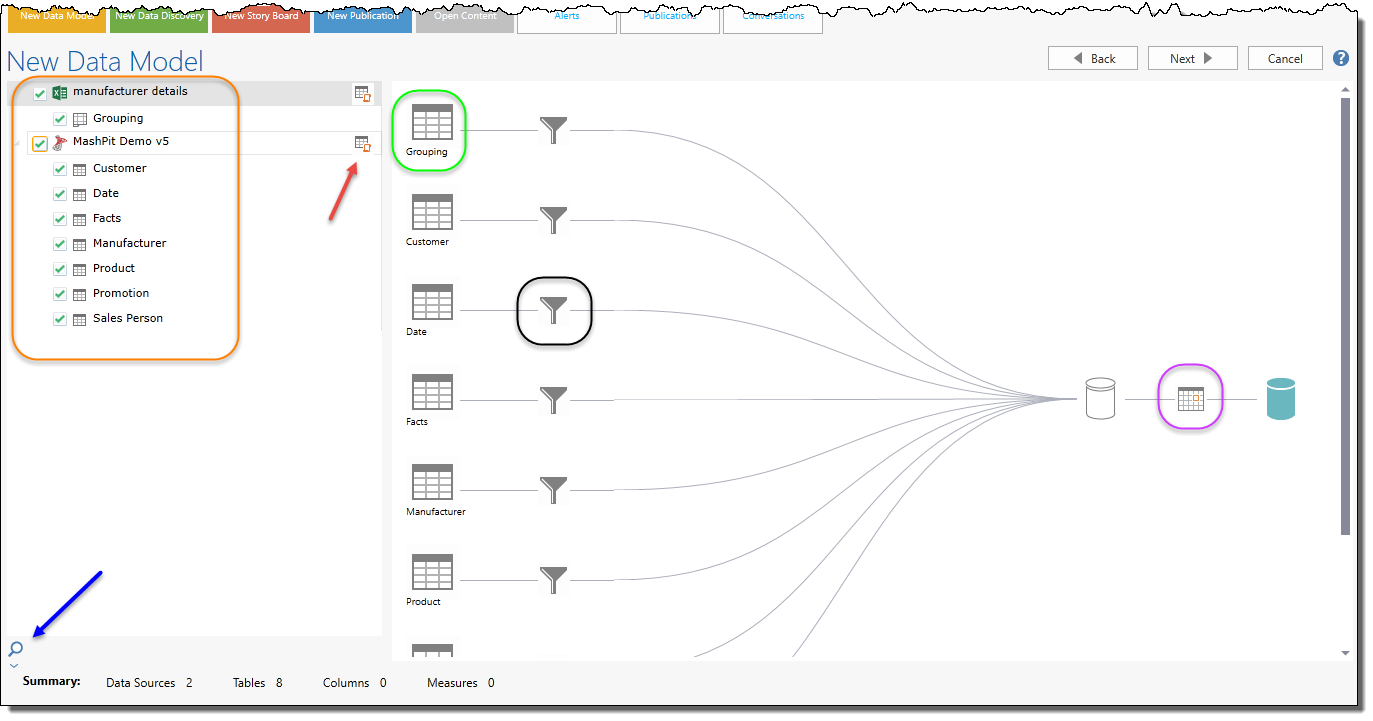
Select which data sets (orange highlight) that will be included in the final model. As you add new data sets (tables), the data flow graphic on the right will show the movement of the data to the model.
- Clicking a table icon (green highlight) will show a sample of its data (by the blue arrow).
- Clicking a filter (black highlight) will allow you to filter the data set before its added to the model.
- Clicking the schedule icon (purple highlight) will allow you to set a refresh schedule for the raw data import into the model
NOTE: for some data source types you can provide a custom script to build the data set using a run-time query of the data source (red arrow).
Click here for more on data set and table selections.
Step 3: Selection of Attributes, Columns and Metrics
For each data set or table selected previously, you can see a list of all its 'attributes' or columns (orange highlight). These columns will be used in your data mode to slice and dice your information. They will also be used to generate the metrics or “measures” of the data model (green highlight).
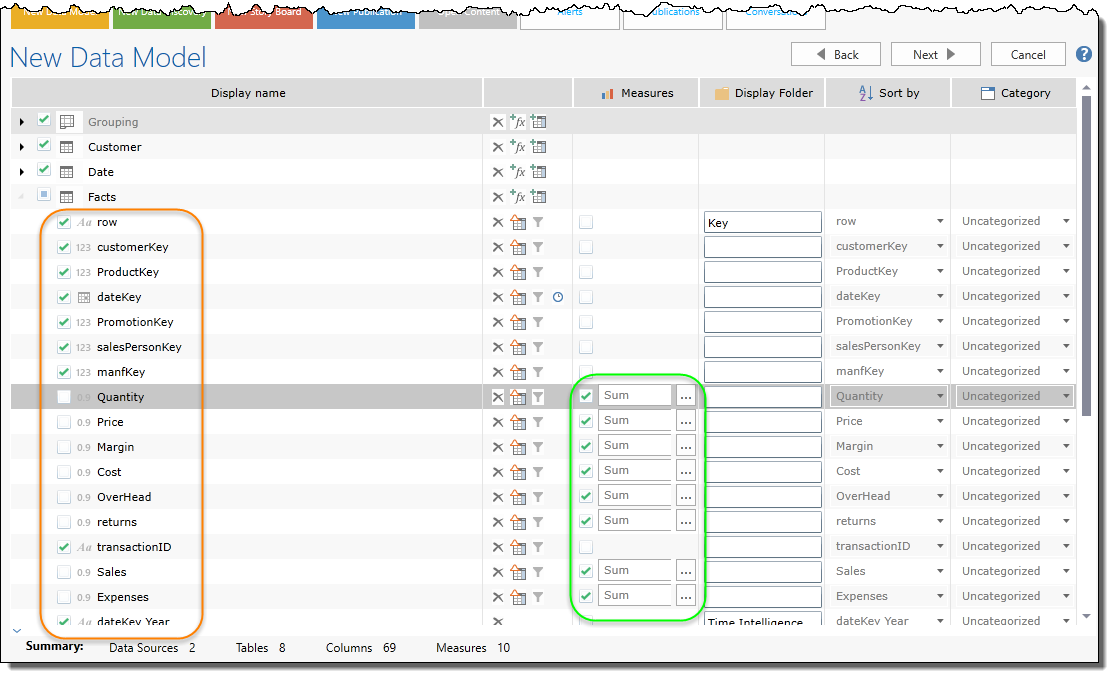
Beyond selecting which columns will be used and made visible in the data model, there are numerous other settings related to sorting, categorization and folder grouping that can be set for each column in the data set. Other capabilities include merging and splitting of column data to create more useful data constructs in the discovery application. The wizard will also allow users to generate 'calculated' columns using formulae to either create column values or derive them from other existing columns in the source data set.
An important feature of the column selection phase is the ability to define metrics for analysis using data in columns. This includes selecting metric columns, setting their formats and aggregation types. Where needed multiple metrics or measures can be set for each column and new calculated measures can be created from existing column data.
Click here for more on column selections.
Click here for specifics on model measures.
Step 4: Relationship Tool
The “Relationship” tool provides an opportunity for users to review, edit and add any connections or “relationships” between your different data sets and tables. This critical step allows you to “mash-up” the different data sets and glue them together for analysis.
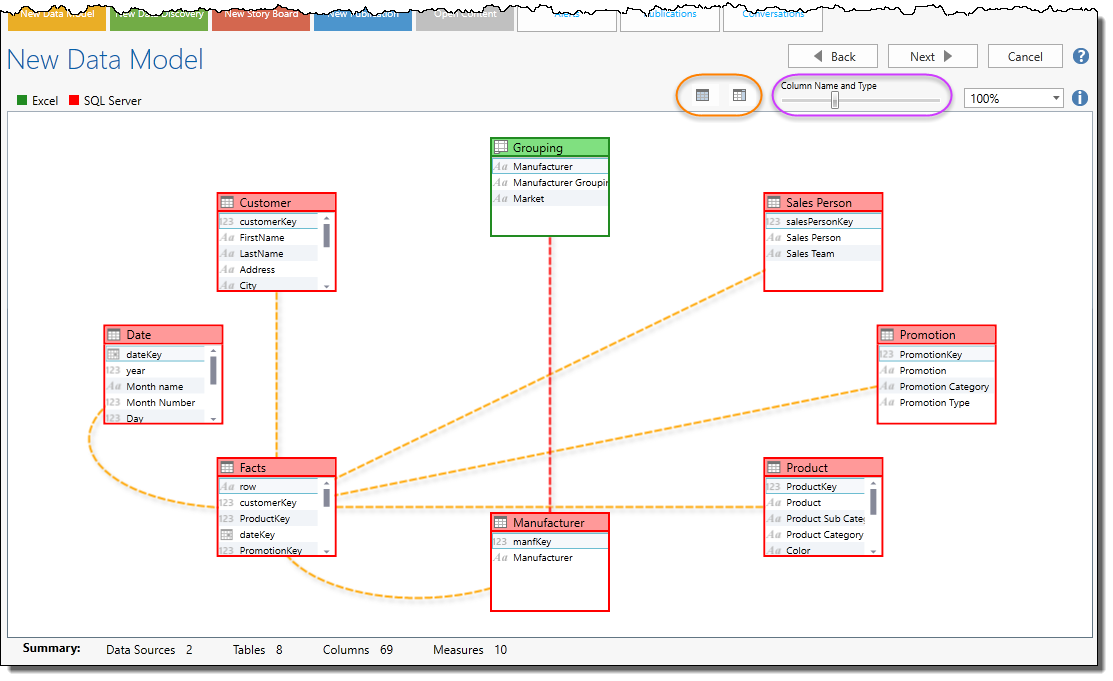
The Data Model engine will extrapolate any relationships that already exists, and highlight them in orange. Using the heuristics slider (purple highlight), the engine will attempt to auto-match and determine relationships between the tables for you in red. Alternatively, you can drag and drop the relationships using the mouse to manually create the "lines" in between the tables.
Use the table view toggle buttons (orange highlight) to see table details.
Click here for more details on the relationship tool
Step 5: Hierarchies
You can optionally add drill-down trees or “hierarchies” to your model to simplify the data navigation in Data Discovery.
NOTE: Hierarchies can also be added directly from inside the Data Discovery while analyzing the model after the model is built.
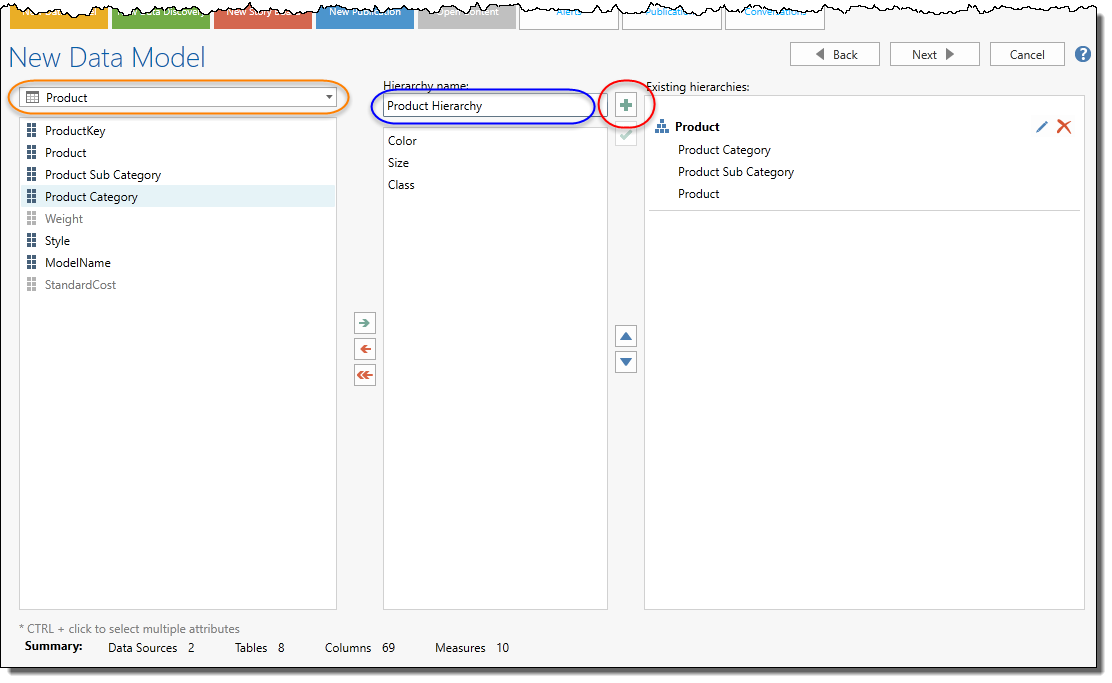
The hierarchy editor will show you a list of columns per data set (orange highlight) - on the left; that can be combined to create the hierarchy drill path - in the middle.
Give the hierarchy a name (blue highlight) and then, once you have built the path, click the green add button (red highlight) to add it to the existing hierarchy listing on the right.
NOTE: The time intelligence option will automatically create relevant hierarchies for you. You can elect to edit these or remove them.
Click here for more on creating hierarchies.
Step 6: Roles & Permissions
The wizard displays the roles and permissions for accessing your data model. From here, you can allow which others in your own groupings can manage and see your model (and which ones cannot). By default, you will always be able to see and manage your own model unless the administrator changes them manually on the backend.
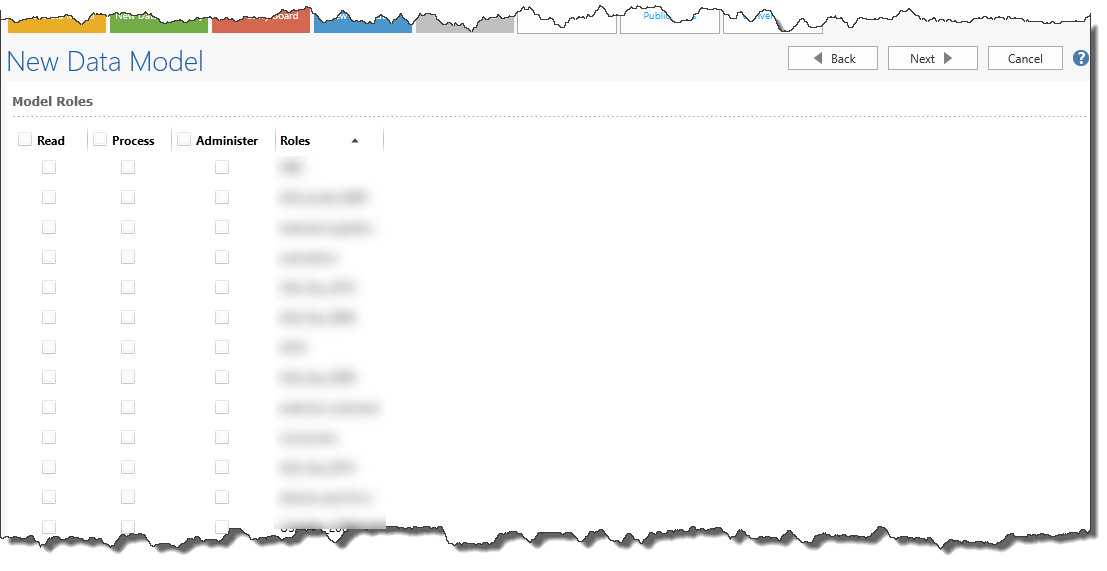
NOTE: The viewable roles reflect the role groupings that you already belong to. Administrators can manually expand this listing through the backend.
Click here for more on securing your data model.
Step 7: Finalization and Deployment
In the last step you need to provide a Model’s Name and Description.
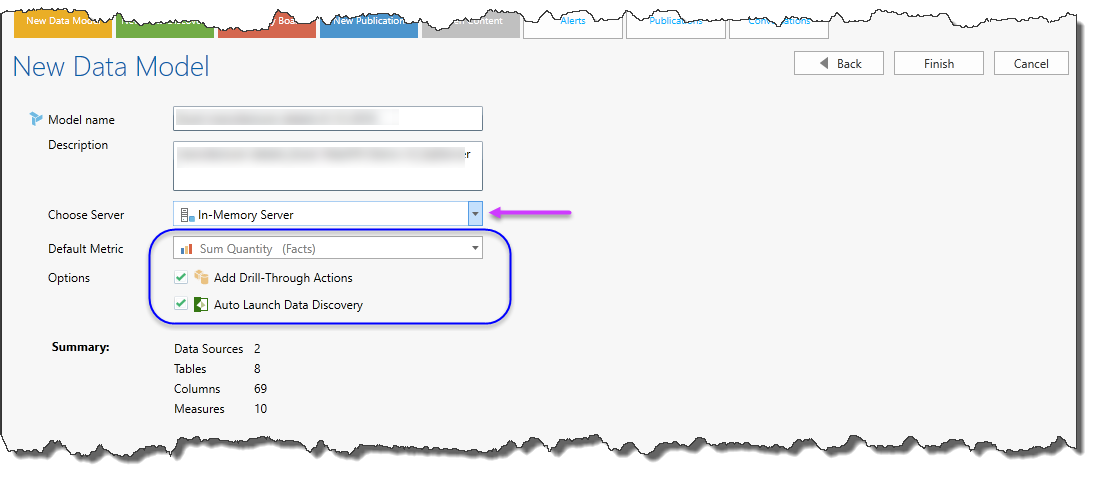
You also need to make a few elections related to the destination server (purple arrow) that will host your model and other default choices (blue highlight). If you are using packages, there will be other choices related to matching reports for the packaged models.
NOTE: Your destination host server list is set from the administrative console.
Model Processing
Clicking finish will launch your model build and deployment job to the server, which will begin the process of extracting the raw data, transforming it and loading it into the new data model on the host server.
You will be presented with a spinner which will be displayed for the duration of the processing cycle (which may take some time).
On completion, if you have elected to auto launch the model you will be directed into a Data Discovery session with your new model. Otherwise, you can then find the new model in the list of data sources on the host server when you start a new the Data Discovery session from the Start page.
Click here for more on the final deployment of your model.
.
Home |
Table of Contents |
Index |
User Community
Pyramid Analytics © 2011-2022